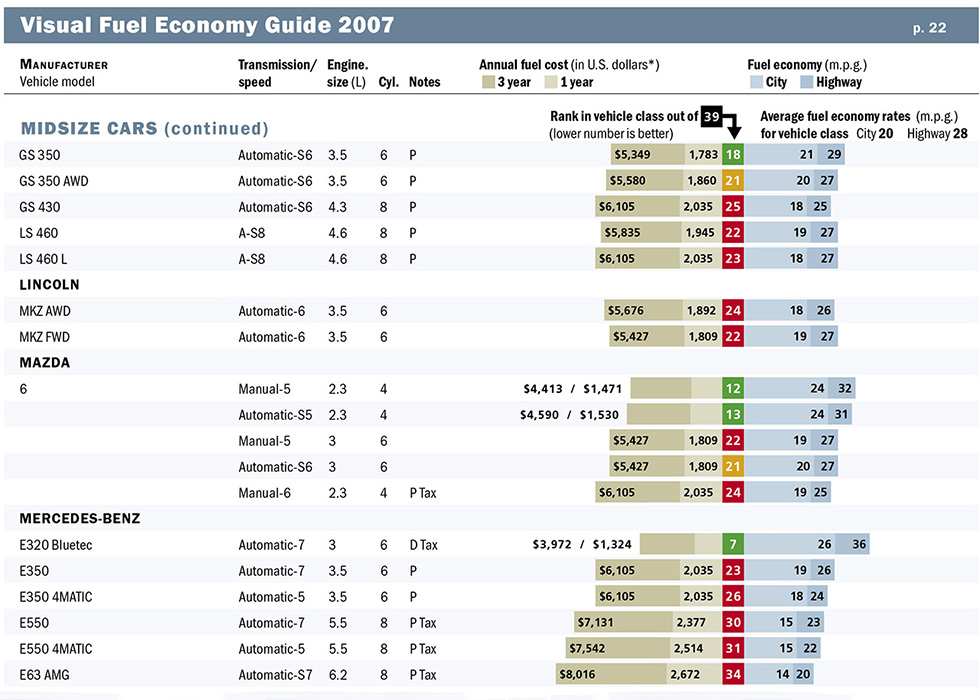
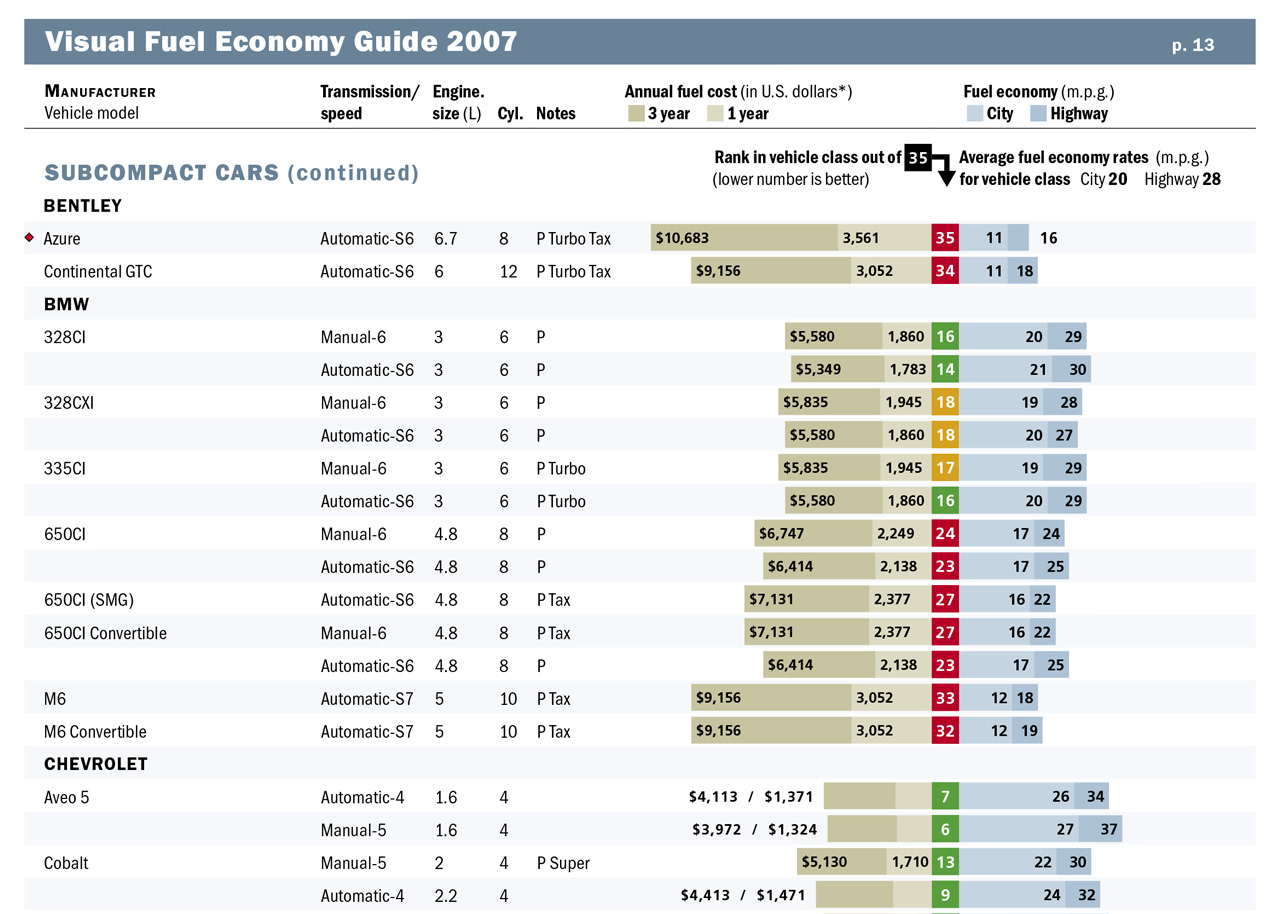
Comparative fuel economy visualization
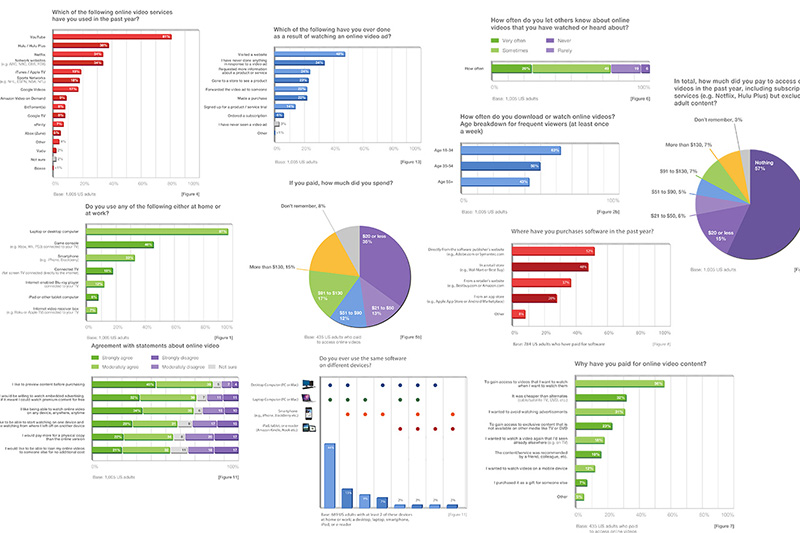
Data Visualization services
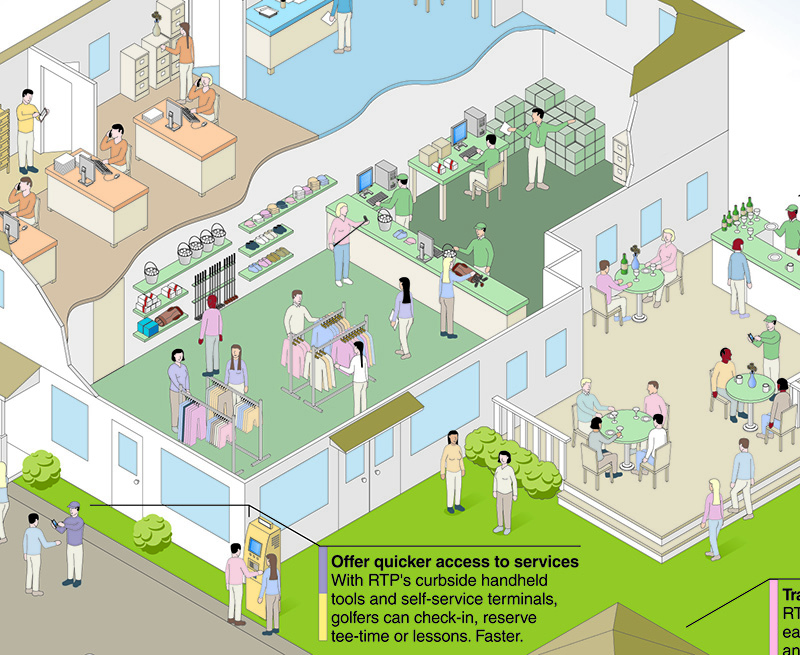
Show the significance of your point-of-view
Data visualizations and infographics are forms of visual storytelling that highlights your information and message with clear comparisons and connections.
Turning ideas into effective visual communication
Luminant Design delivers charts, infographics, and explanatory diagrams that draw the reader in and deliver your ideas in a clear, compelling way. We design using our “Bright Insight” methodology. Through established techniques we start with learning your communication objectives to shape the presentation format. To ensure validity to your arguments, we study your data for trends, opportunities and overlooked gaps. To ensure relevance, we evaluate your intended audience and confirm the best presentation format –both in visual interest for audience engagement and in substance at a level that is appropriate to your audience knowledge level. We methodically confirm these insights with you and then build the visualization in a tight, cohesive fashion.
Master standards
Where data visualization involves campaign-level coordination, such as annual reports, instructional guides and multi-set information campaigns, Luminant Design specializes in developing clear standards to guide your group efforts and ensure consistency at the communication campaign level.